
It’s not always about the absolute best indicator, or the absolute best prediction, for trading to be successful. The steady traders realize the markets always adjust from outlooks of buying pressure to ones of selling pressure, uncertainty to opportunity, and back again. Understanding how these forces react and interact can assist a trader in making extra informed choices within the trade, instead of being driven by emotion.
Balance in trading is the way by which both buyers and sellers settle on a price for a while till someone gets the better of the other. This equilibrium shows up in various ways, such as price patterns, market profiles, volume configurations, and so forth. Identifying such situations could indicate potential breakouts, reversals, or trend continuations for traders.
Many novice traders just pay attention to the trend of the market. Sophisticated traders do more than this; they wonder about the reasons behind price action, where buyers defend levels, and where the sellers are making a strong push. By understanding the balance between supply and demand in the market, one can gain a better insight into its movements, enabling the creation of a disciplined trading strategy.
What Does Balance Mean in Trading?
So, market balance, in simple terms, is where buyers and sellers are matched at least for a moment while maintaining a balance. An equilibrium exists in a particular price range where neither side is willing to push prices up or down.
It does not indicate, however, that the market is inactive. Despite the equilibrium state, thousands of transactions take place with traders swapping positions. The answer is that buying and selling are more balanced, after which a powerful directional move fails to take place.
For instance, if a stock moves between $98 and $102 for a number of sessions. Buyers feel that at $98 it is an attractive price, while sellers think that getting rid of the same at $102 will be a lucrative move. Price typically may keep trading in this range until one party moves to become more aggressive.
Technical traders call these ranges ‘consolidation zones’. These zones are important as they often precede big moves. A market closing out of balance can mean that one party is sufficiently dominant to be able to move the price.
Professional traders use balance to determine the answers to some of the most important questions:
- In which market are you comfortable trading?
- What are the point levels that appeal to respective consumers or suppliers?
- Will present velocity have an impact on velocity?
- Let’s start by answering this conundrum: Where should risk be managed?
The projections are not meant to be certain, but to illustrate where chances of success may be higher.
How Traders Identify Market Balance
There are several ways traders recognize balanced conditions. Successful traders usually combine multiple tools rather than relying on a single signal.
Price Ranges and Consolidation
The easiest method to spot balance is via a sideways price range. Candles are between multiple consistent support and resistance levels, indicating the market is willing to accept the price levels.
A tight range can be a sign of hesitation. Buyers are waiting for better prices, and sellers are reluctant to be aggressive in reducing prices. At some time, it may be due to news, high momentum, or institutional activity; price can fall out of range and break out of the range.
Volume Analysis
Volume holds vital clues of participation in the market. Periodic trade volume in a balanced market might not indicate a dominating trending behavior.
Volume is typically used as an indicator of strength, and traders will often regard a sharp rise in volume as an indication that the price is being controlled by one side or the other when volume actually increases while price is moving away from a range.
For example:
- An upward breakout with a lot of volume might point to greater buyer activity.
- If the volume is high whereas the stock price falls below its support level, while in that case it may be a sign that sellers are taking over.
While it’s important to remember that volume is not used to determine a successful trade, it does give a trader a sense of how strong the price movements are.
Initial Balance Concept
A second well-liked method is through Market Profile analysis. Initial Balance is the initial time period after a market holiday when a “balance” is created, typically the first hour of trading. The range allows traders to determine if the session is set for a continuation of balance or is an opportunity to trade a directional move.
When the price stays within the initial price range idea, then the market would be searching around for fair value. But decisive moves out of the range can signify the buyer or seller is gaining the upper hand.
Balance of Power and Market Strength
Balance isn’t just about price levels. Another area that traders practice revolves around the dynamics of the buyers and sellers when using indicators to measure control in the market.
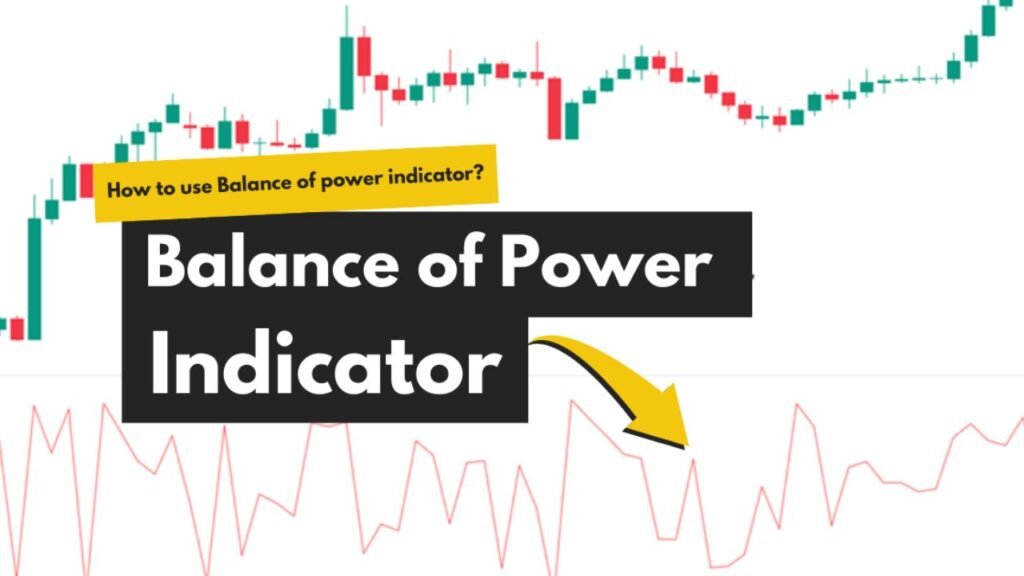
One such example is the Balance of Power (BOP) indicator. It tries to determine whether buyers or sellers are with the upper hand by assessing how the price moves in a trading window. When the readings are positive, it may mean that there are more buyers than sellers, and negative readings may mean that there are more sellers than buyers.
Indicators should not be interpreted as a signal to buy/sell, however. One of the mistakes that many new traders make is the notion that they can rely on one specific indicator for their answers.
A more effective solution is to combine information:
- Price structure indicates the important levels.
- Volume is an indicator of participation strength.
- “Indicators furnish further confirmation.
- Managing risk is a way of saving the trader’s capital used for trading.
For example, volume spikes when price is breaking above resistance, but with only one momentum indicator showing a strong buying move, the evidence could be greater than relying on any one measurement alone.
Trading Strategies Based on Market Balance
Understanding balance becomes valuable when traders know how to apply it. Below are several common strategies built around market equilibrium.
Range Trading Strategy
Range traders hunt for opportunities when the price is ranging between support and resistance.
Common practice includes a method that is:
- Making purchases at identified support levels.
- Selling and/or taking profits near the level of resistance.
- Taking stop-loss orders out of the range.
This strategy is best suited to the market, where there is no strong trend. It is important to be cautious, as all ranges eventually will break, and sometimes false breakouts will indicate the end of the range.
Breakout Trading Strategy
Breakout traders will be looking for the time when balance ceases.
Traders wait for price to break out of a consolidation region with solid momentum, for any indications that a new trend is forming.
Significant confirmatory factors are:
- Increased trading volume.
- Strong candle closes above/below the important levels.
- Testing old supports and/or old resistances.
- Broader market alignment.
However, following a breakout, many professional traders don’t rush to get in for fear of panic buying or selling, thus creating a less than favourable entry price. Delays and waiting for proof can minimize extra risks.
Trend Continuation Strategy
Markets tend not only to exist at a balance but can also swing from balance to imbalance and back. Knowing the trend cycle enables traders to search for potential trading opportunities when there are clear trends.
For instance, following a solid gain, price can trade ahead before moving higher. This short-term equilibrium provides traders insight into whether or not the buyers are still in charge.
The important thing is to determine if the consolidation is merely healthy rest or if it’s a red flag and a sign of weakness in the trend.
Common Mistakes Traders Make When Using Market Balance
Although balance concepts are powerful, they can be misunderstood. Several mistakes can reduce their effectiveness.
Assuming Every Breakout Will Continue
Moving from a breakout is no guarantee of the formation of a new trend. The markets often make false moves, which are short-term ranging violations.
By waiting for confirmation instead of acting first based on price action, traders can make more informed decisions.
Ignoring Risk Management
Even if the best analysis is done, it can go astray. When evaluating one of the position-size trading rules, you need to remember that a trader must know how to manage market balance; otherwise, they may end up with big losses.
Risk management includes:
- Implementing the right stop losses.
- Avoiding oversized positions.
- Ensuring the security of capital in non-conducive circumstances.
Using Too Many Indicators
It is not that simple to get better results by adding one indicator to another. Too much analysis can lead to confusion at times.
With price action, volume, and one or two confirmation tools, you can more often end up with a less cluttered chart with fewer confusing signals that will make you money.
Trading Without Understanding Context
The concept of market equilibrium can vary in different contexts. Ranges in a quiet session can look different than ranges on big news.
Traders should consider:
- Overall market trend.
- Volatility conditions.
- Upcoming events.
- Timeframe being analyzed.
Frequently Asked Questions
What is balance in trading?
In trading, balance describes a price that is relatively insensitive to strong buying and selling pressure and moves within a range that is acceptable before a stronger resistance or support trend is formed.
Is a balanced market good for traders?
Yes indeed, there is valuable information in a balanced market. It can guide traders towards significant resistance and support levels and predict potential breakouts.
How do traders find market balance?
Buyers’ and sellers’ strength indicators, Market Profile concepts, volume analysis, and trading price ranges are all used by traders to determine balance.
Does market balance predict future price movement?
No, balance does NOT indicate which way the price will go next. It assists traders in comprehending the existing scenario and making more possibility-driven decisions.
What tools can traders use to analyze balance?
These involve using volume analysis, support and resistance levels, Market Profile tools, VWAP, and momentum indicators like Balance of Power.
Conclusion
Markets continuously pend between balance and imbalance depending on whether the buyers or sellers have the upper hand. Those traders who know these transitions will know how to make better decisions than trading just according to the price motions. Balance can provide an indication of where the market is comfortable, when the momentum is shifting, and even where opportunities are possible.
The fact that there’s no way to remove uncertainty from a trader’s portfolio doesn’t mean markets can’t be analyzed for their structure and volume, and traders for their disciplined risk management, to create a more consistent strategy. It is not the strongest traders who predict each and every move, but it is the traders who understand market behavior and make their decisions with patience.